
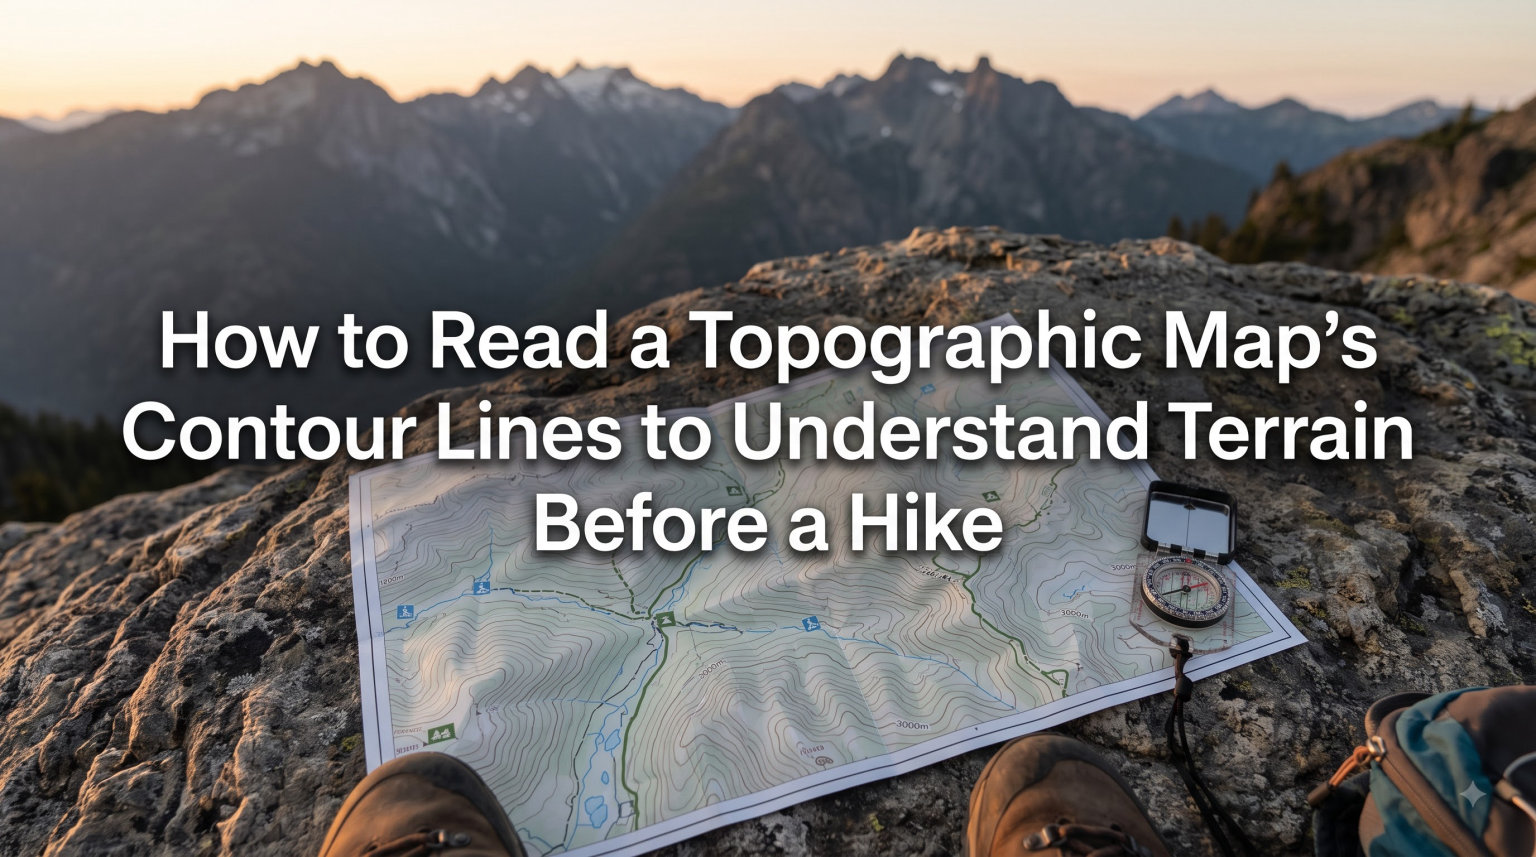
Standing at a trailhead with a topo map in hand, those curving brown lines can look like abstract art if you have never learned to read them. I remember my first backcountry trip. I could barely tell a cliff from a meadow on paper, and it cost me a wrong turn and an extra hour of uphill scrambling.
Once I learned how to read topographic map contour lines, everything changed. Those lines tell you where the ground rises, how steep a section is, and where you will find valleys, ridges, and peaks. Understanding them before you hike means fewer surprises on the trail, smarter route decisions, and a real sense of what your body is about to go through.
This guide breaks down everything you need to read contour lines with confidence. We will cover definitions, spacing rules, terrain features, contour intervals, and even a hands-on exercise you can do at your desk right now.
Table of Contents
What Are Contour Lines on a Topographic Map?
Contour lines are brown curved lines on a topographic map that connect every point at the same elevation above sea level. Imagine slicing a hill horizontally at perfectly equal height intervals, with every slice creating an outline. Those outlines, projected onto flat paper, become your contour lines.
Each line represents one specific elevation. If a line is labeled “800,” every point along that line sits 800 feet (or meters, depending on your map) above sea level. Move to the next line inward and you are at a higher point. Move outward and you descend.
This system translates 3D terrain into 2D. A single glance at how these lines bend, space, and cluster tells you the shape of the land. I think of them as elevation contours that trace the physical form of mountains, valleys, and ridges like a fingerprint of the earth’s surface.
How Contour Lines Show Steepness (The Spacing Rule)
The spacing between contour lines tells you exactly how steep the terrain is. This is the single most important rule when you read topographic map contour lines, and it is refreshingly simple.
When contour lines sit close together, the elevation changes rapidly over a short horizontal distance. That means steep terrain, think cliffs, headwalls, and grueling climbs. When lines spread far apart, the elevation changes gradually. That is gentle terrain, the kind of rolling hills and open meadows where you can keep a steady pace.
I use a quick mental test on every hike. If I can count five or more contour lines within the width of my thumbnail on the map, I know I am looking at a serious climb. If the lines are so tight they nearly merge into one thick line, that is likely a cliff that could be impassable without climbing gear.
This spacing-to-steepness relationship works everywhere, from USGS quads to digital apps like Gaia GPS and CalTopo. Get comfortable reading spacing and you have mastered about 80% of what topo maps can tell you.
Understanding Contour Intervals and Index Contours
The contour interval is the fixed elevation difference between two adjacent contour lines. On most USGS maps in the United States, this is 40 feet. On Ordnance Survey maps in the UK, it is often 10 meters. The interval stays constant across a single map, so once you know it, you can calculate the elevation of any point.
You will find the contour interval printed in the map legend, usually near the bottom margin. I always check it before reading anything else. A 20-foot interval paints a very different picture than a 40-foot interval for the same section of trail.
Index contours are the heavier, darker lines that appear every fifth contour line. They exist to keep the map readable. Instead of straining to count individual lines up a mountainside one by one, you can jump by the index interval, which is typically 200 feet on USGS maps.
Each index contour is labeled with its elevation number, and that number serves as your anchor point. From there, count intermediate lines up or down, multiplying by the contour interval, to pinpoint the height of any spot on the map.
What Do the Numbers on Contour Lines Mean?
The numbers printed on contour lines are elevation values measured in feet or meters above sea level. They tell you the exact height of every point along that specific line.
These numbers appear most often on index contours, but you will also see them on intermediate lines in areas where the mapmaker wanted extra clarity. The text usually reads upright when you face uphill, which can help you figure out slope direction at a glance.
One common source of confusion for beginners: these numbers represent cumulative height from sea level, not the height of the hill itself. A line labeled 6,000 feet means that ground sits 6,000 feet above the ocean, whether you started your hike at 2,000 feet or at the beach. Always confirm whether your map uses feet or meters to avoid serious miscalculations on the trail.
How to Read Topographic Map Contour Lines to Identify Terrain Features
Contour lines form recognizable patterns for every major landform. Once you learn these shapes, you can scan a map and instantly spot peaks, valleys, ridges, saddles, and depressions without guessing.
Peaks and Summits
Peaks appear as concentric circles, nested rings getting smaller as they climb toward a single high point. The smallest, innermost ring marks the top. Think of a bullseye target on the map.
Valleys and Drainages
Valleys form V-shaped or U-shaped contour lines pointing uphill, toward higher elevation. The point of the V shows the direction water would flow, which is downhill. I always scan for these to locate streams, creeks, and low-traffic route options.
Ridges and Spurs
Ridges are the mirror image of valleys. Their contour lines form V or U shapes pointing downhill, away from the high ground. Ridges often make excellent travel routes because they stay above drainages, dry out faster after rain, and offer better sightlines.
Saddles
Saddles are the low points between two higher areas. On a map, they look like an hourglass, with contour lines pinching together between two sets of concentric circles. Saddles are key landmarks for confirming your position and serve as natural crossing points between peaks.
Depressions
Depressions look like inverted peaks, concentric circles with small tick marks (called hachures) pointing inward toward the low point. These could be craters, sinkholes, or old quarries. The inward-facing hachure marks are what distinguish a depression from a summit at a glance.
The 5 Rules of Contour Lines Every Hiker Should Know
These five rules cover the fundamental behavior of contour lines on every topographic map ever made. Memorize them and you will avoid most interpretation errors in the field.
Contour lines never split. A single line represents one continuous elevation. It may loop, bend, or run off the map edge, but it never divides into two separate lines.
Contour lines never cross. Two different elevations cannot occupy the same point on the ground. The only apparent exception is an overhanging cliff, where lines seem to merge on a standard 2D map.
Closely spaced lines mean steep slopes. Widely spaced lines mean gentle slopes. This is your go-to rule for reading trail difficulty at a glance.
Every point on a contour line shares the same elevation. If a line reads 2,400 feet, every inch of that line sits 2,400 feet above sea level, no exceptions.
Contour lines eventually close into loops. Even if a loop extends beyond your map sheet’s edge, it closes somewhere. The terrain returns to the same elevation or continues around the planet.
Map Scale and Calculating Gradient on a Topo Map
Map scale tells you the relationship between distance on paper and real-world distance on the ground. A scale of 1:24,000, which is standard for USGS 7.5-minute quadrangles, means one inch on the map equals 24,000 inches (2,000 feet) in reality.
For hikers, the practical takeaway is straightforward. Larger-scale maps like 1:24,000 show more detail and are ideal for trail-level planning. Smaller-scale maps like 1:100,000 cover more area but sacrifice contour detail, making them better for big-picture route planning.
To calculate gradient, divide the total elevation change by the horizontal distance traveled. If a trail gains 1,000 feet over half a mile (2,640 feet), the gradient is 1,000 divided by 2,640, or roughly 38%. That is a steep grade, and you should expect switchbacks, slow progress, and heavy breathing.
I run this calculation for every segment of a new trail during trip planning. It helps me set realistic time estimates, decide where to schedule rest breaks, and identify sections where I might need extra water or a morale boost.
Hands-On Practice: The Knuckle Mountain Exercise
This is the single best way I have found to bridge the gap between 2D contour lines and 3D terrain, and it takes about two minutes at your desk.
Make a fist with your non-dominant hand, knuckles facing up. Your fist is now a miniature mountain range. The knuckles themselves are peaks, the dips between them are saddles, and the creases where your fingers fold into your palm are valleys.
Now look straight down at your fist from above. That bird’s-eye view is exactly what a topo map shows. Trace the outline of a single knuckle with your eyes. Notice how it forms a near-circle, just like a summit’s concentric contour lines on the map.
Look at the slope between two knuckles. The contour lines there would space tightly on the steep sides and spread apart on the gentler slopes. The valley where your fingers meet your palm forms a clear V pointing uphill toward the peaks.
Do this exercise once and the 3D-to-2D translation clicks permanently. It is the reason this visual trick shows up in forums and outdoor education courses as the go-to teaching tool for beginners.
Common Mistakes When Reading Topographic Maps
Even experienced hikers misread topo maps from time to time. These are the errors I see most often, along with how to avoid each one.
Confusing Valleys and Ridges
The V-shape pattern looks similar for both features, which trips up beginners constantly. The fix is simple: valley Vs point uphill toward higher elevation, while ridge Vs point downhill toward lower ground. When the direction is unclear, check the elevation numbers on nearby index contours to confirm which way is up.
Ignoring the Contour Interval
Two maps can look nearly identical but have completely different intervals. A cluster of tight lines on a 20-foot interval map represents a far gentler slope than the same visual cluster on a 40-foot map. Always verify the interval in the legend before judging steepness.
Mixing Up Feet and Meters
USGS maps use feet. Many international maps use meters. Mixing these units can turn a moderate 300-meter climb into a theoretical 300-foot stroll, or vice versa. Check the units in the legend and stick with them throughout your planning.
Trusting Outdated Maps
Trails get rerouted, forests regenerate, roads appear, and bridges wash out. A topo map printed decades ago may no longer match reality on the ground. Check the publication date, and cross-reference with current digital tools or recent trip reports from other hikers before committing to a route.
Quick-Reference Contour Rules Checklist
Save this checklist to your phone or print it for your next hike. It covers the essentials you need in the field.
Close lines = steep terrain. Wide lines = gentle terrain.
Index contours (bold lines) appear every fifth line and carry elevation numbers.
Check the contour interval in the legend before reading anything else.
Concentric circles = peak or summit.
V-shapes pointing uphill = valley or drainage (water flows downhill from here).
V-shapes pointing downhill = ridge or spur.
Hourglass pinch between two peaks = saddle.
Concentric circles with inward tick marks = depression or pit.
Numbers on lines represent elevation above sea level, not hill height.
Always confirm feet vs. meters before planning your route.
Putting It All Together for Your Next Hike
Before your next trip, pull up a topo map of your planned route and work through a simple sequence. Start by finding the contour interval in the legend. Then trace your intended trail from start to finish, marking the sections where lines bunch together. Those tight clusters are your hard climbing sections.
Identify potential water sources by following V-shaped valley contours downhill to where streams collect. Look for saddles as natural rest stops with panoramic views. Flag any cliff bands, areas where lines nearly merge, as zones to approach with extra caution or avoid entirely.
I also recommend cross-referencing your paper map with a current digital tool. CalTopo and Gaia GPS both let you overlay contour lines on satellite imagery as of 2026, which reinforces what the abstract lines represent in reality. Pairing traditional map-reading skills with digital confirmation builds genuine confidence over time.
The more you practice on maps of trails you already know, the faster this skill becomes automatic. Start with familiar terrain, then work up to routes you have never seen in person.
FAQs
How can you interpret a contour map?
You interpret a contour map by reading the spacing, shape, and numbering of its contour lines. Closely spaced lines indicate steep slopes, while widely spaced lines show gentle terrain. Concentric circles mark peaks, V-shapes pointing uphill reveal valleys and drainages, and V-shapes pointing downhill indicate ridges. Elevation numbers on index contours anchor your height calculations, and the contour interval printed in the legend tells you the elevation difference between adjacent lines.
What are the 5 rules of contour lines?
The five rules are: (1) contour lines never split or divide into separate lines, (2) contour lines never cross each other, (3) closely spaced lines mean steep slopes while widely spaced lines mean gentle slopes, (4) every point on a single contour line sits at the same elevation, and (5) contour lines eventually form closed loops even if the loop extends beyond the map’s edge. These rules apply to every topographic map.
How to analyze contour lines?
Start by checking the contour interval in the legend. Then identify index contours (the bold, numbered lines) to anchor your elevation readings. Read the spacing between lines to determine slope steepness, identify terrain shapes such as concentric circles for peaks or Vs for valleys and ridges, and count the number of lines between two points to calculate total elevation change. Always confirm whether the map uses feet or meters.
What do numbers mean on contour lines?
Numbers on contour lines represent elevation above sea level, measured in either feet or meters. Every point along that specific line sits at that exact height. These numbers appear most often on index contours (the bolder, heavier lines) and help you calculate the elevation of any point on the map by counting contour lines up or down from the labeled value and multiplying by the contour interval.
Conclusion
Learning to read topographic map contour lines transforms how you prepare for every hike. What once looked like random brown squiggles becomes a clear picture of peaks, valleys, ridges, and slopes. The spacing rule alone, close means steep and wide means gentle, covers most of what you need on the trail.
Start with the knuckle exercise to lock in the 3D visualization. Memorize the five rules. Then practice on topo maps of trails you already know so you can compare the paper to what you remember from being there. Before long, you will plan routes with confidence and tackle unfamiliar terrain with a clear mental picture before you ever set foot on the trail.
Grab a topo map of your next destination and start reading those lines today.